Hi Guys,
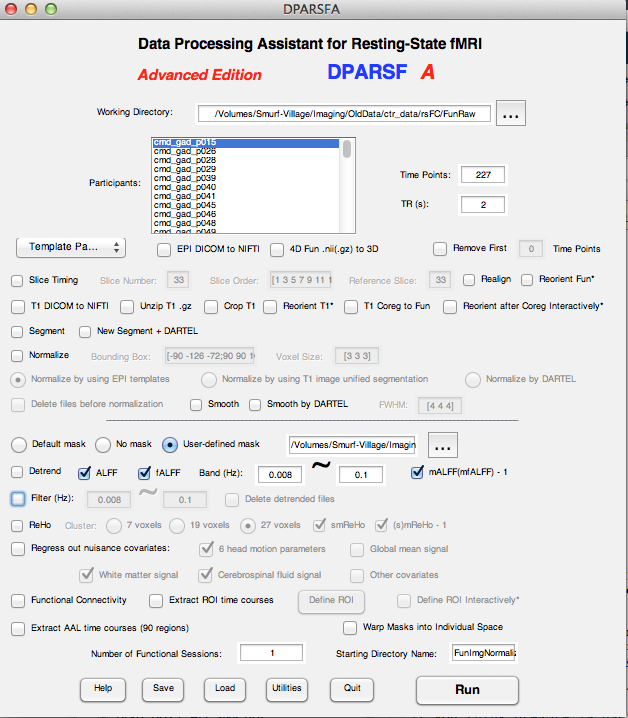
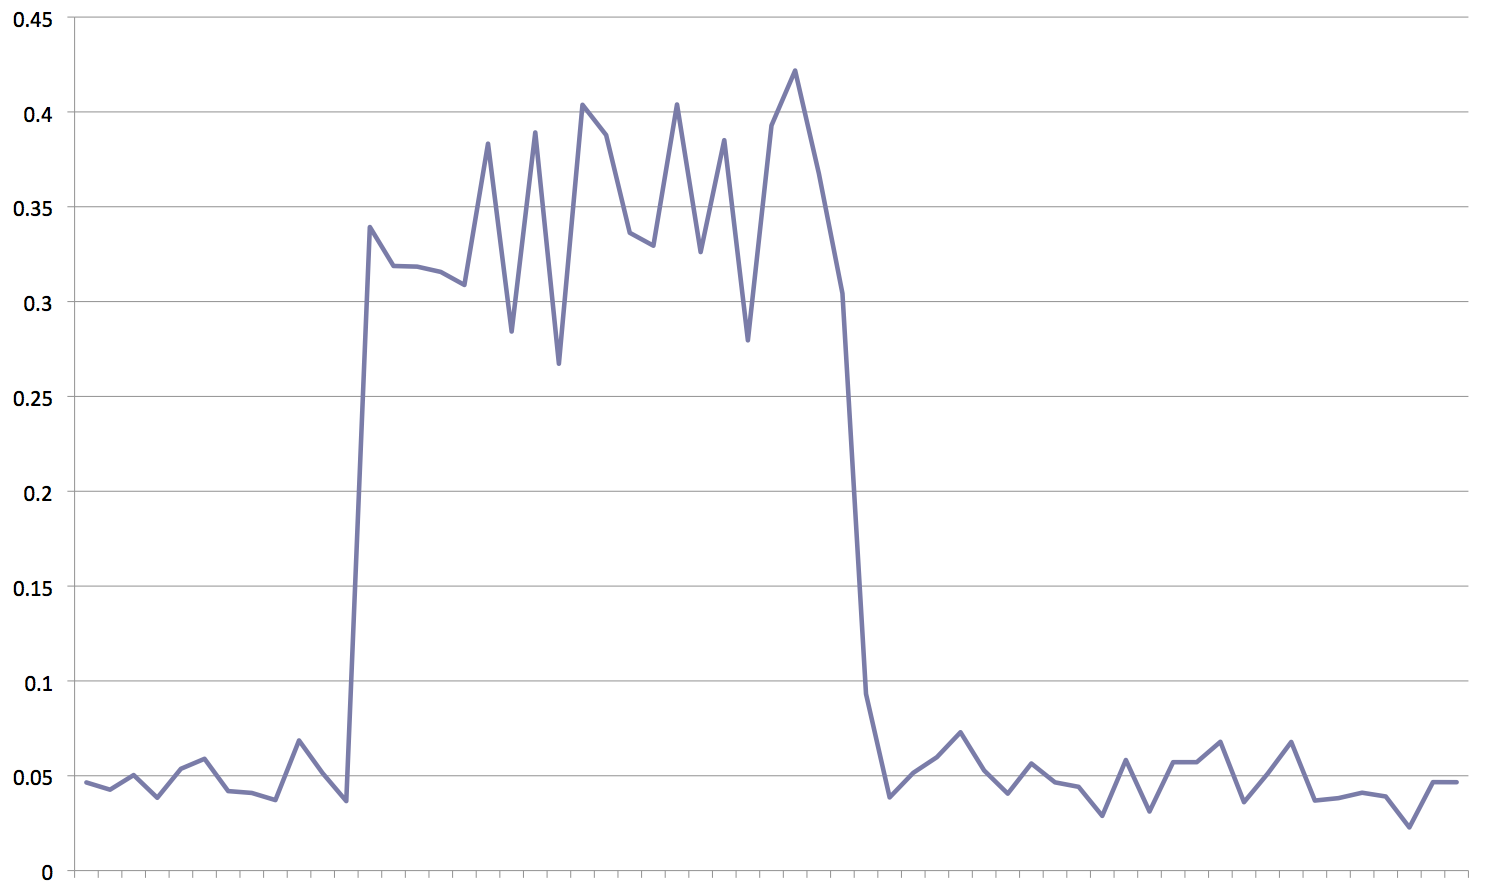
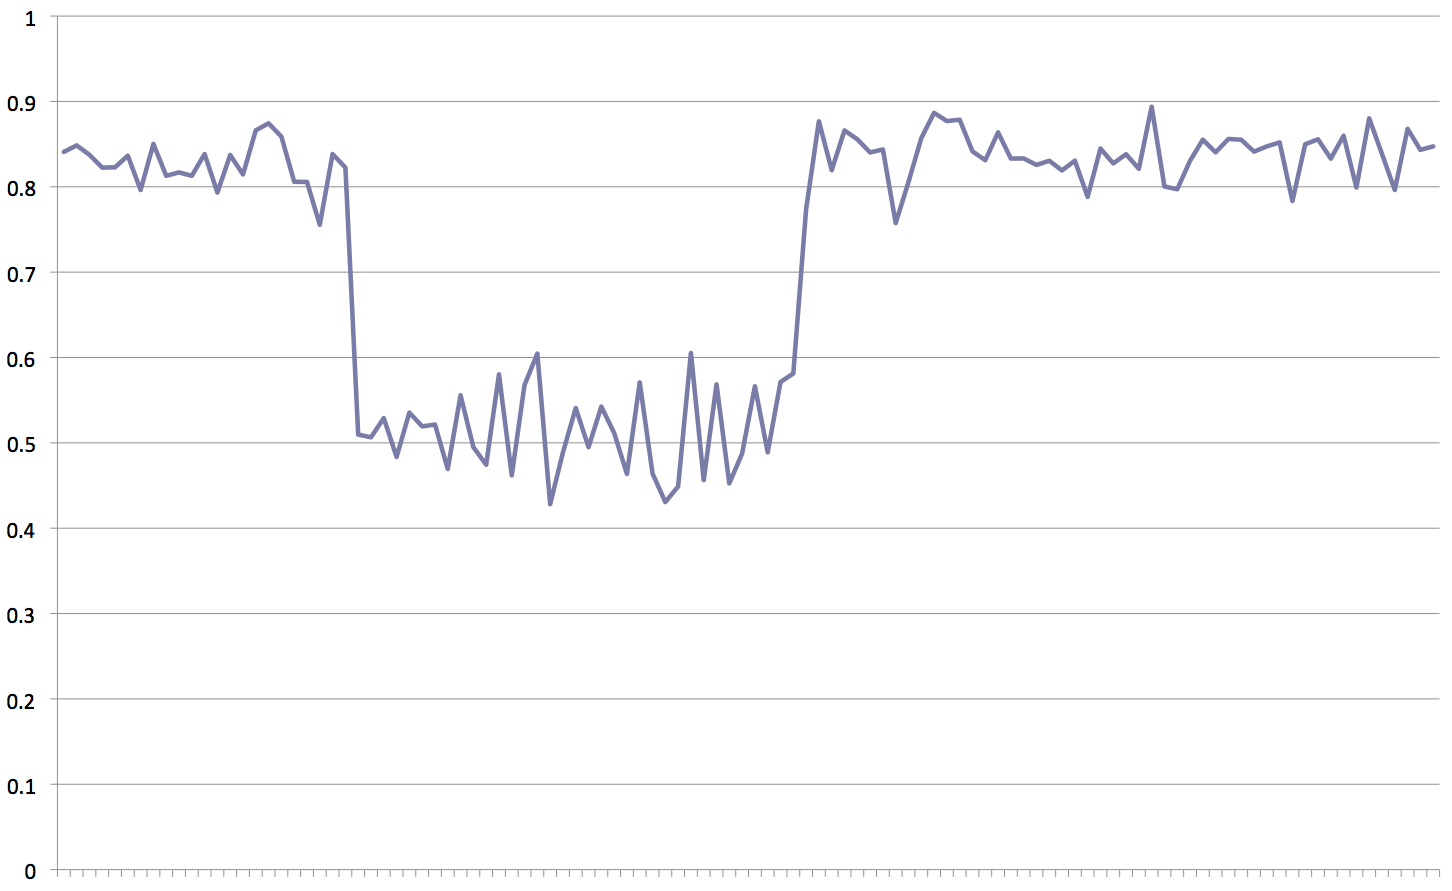
I processed several psychiatric groups (no likely gross structural brain differences) with the DPARSFA toolbox to calculate power in resting state fMRI images (see screenshot). I found group differences in mfALFF so went to explore whether the fALFF, mALFF, and ALFF images looked different in the same way. What I found is that there was a freakishly massive difference in both fALFF and ALFF (FDR q.000000000000 etc.). ALFF was in the same direction as the mfALFF difference and fALFF was in the opposite direction. These are all gray matter masked. I extracted average gray matter fALFF for the inclusive low frequency band (0.008-.1 Hz) and a higher frequency band (0.1-0.25 Hz). As you can see from the graphs, this one particular group showed a much much lower level of LF power and corresponding much much higher level of HF power (same group). All of these subjects were processed in the same way, at the same time. They came from the same scanner, using same sequence, and are in all ways the same as far as I know.
This gross group difference in the basic numbers that go into mfALFF make me very nervous in interpreting the ultimate group effect. Is that reasonable? Any ideas why I see such a massive effect in the fALFF and ALFF images?
Thanks, in advance, for any suggestions.
Desmond
| Attachment | Size |
|---|---|
| 114.28 KB | |
| 90.46 KB | |
| 89.46 KB |
Submitted by djo155 on Sat, 12/15/2012 - 08:59 Permalink
Re: ALFF, fALFF, mfALFF, mALFF
Oh, and motion does not vary by group.
D
Submitted by ZangYF on Wed, 12/19/2012 - 05:53 Permalink
Re: ALFF, fALFF, mfALFF, mALFF
"I extracted average gray matter fALFF for the inclusive low frequency band (0.008-.1 Hz) and a higher frequency band (0.1-0.25 Hz). As you can see from the graphs, this one particular group showed a much much lower level of LF power and corresponding much much higher level of HF power (same group). " From the two figures, such patterns seem wired. However, the relative value of high frequency is lower than that of low frequency. This is reasonable. You can try a single voxel in a specific brain area, say, PCC. The averaged power spectrum in all gray matter might be too complex.
"ALFF was in the same direction as the mfALFF difference and fALFF was in the opposite direction." The opposite direction in the same voxel? If not, might sound reasonable.
Submitted by YAN Chao-Gan on Thu, 12/20/2012 - 03:04 Permalink
Re: ALFF, fALFF, mfALFF, mALFF
Hi Desmond,
What's the x ais for the graphs? For different subjects? And y axis is fALFF? For those with fALFF~0.4, they belong to the same group and the others in another group? I really doubt there is something wrong with the preprocessing.
Best,
Chao-Gan
Submitted by djo155 on Thu, 12/20/2012 - 03:41 Permalink
Re: ALFF, fALFF, mfALFF, mALFF
Correct. X-axis shows individual subjects clustered by their group. And again, correct: those with values together are in the same group.
It sounds like you think that these differences are not strange enough, even comparing non-neurological psychiatric groupings, to think that the preprocessing could be at fault. Do you have any suggestions/papers to aid in interpretation?
Many thanks!
Desmond
Submitted by YAN Chao-Gan on Sat, 12/29/2012 - 06:03 Permalink
Re: ALFF, fALFF, mfALFF, mALFF
Hi Desmond,
Merry Christmas and Happy New Year!
Sorry for the delay in response. I really doubt if there is something wrong with the data. You got the high frequency fALFF and low frequency fALFF by setting up the frequency band and processed twice, right? The scripts for extracting the values are all correct? Could you go back to check the original data for those subjects with weired fALFF distribution (make sure the TR and nubmer time points are correct for these subjects). This variation in fALFF really looks like those difference plots with different TR and nubmer of time points.
Best,
Chao-Gan