Submitted by Helen Sawaya on Thu, 06/13/2013 - 15:45
Dear all,
I am new to DPARSF and I have a question concerning the z transformed functional connectivity maps. I am a bit surprised at the results because the z values of my maps are pretty low (most are between -0.6 and 1). I did not globally regress my images and I expect at least a few voxels to have values of 3 or 4. Anyone has any ideas as to why that is happening?
I appreciate your help
Thank you
Helen
| Attachment | Size |
|---|---|
| 89.08 KB |
Submitted by ZangYF on Wed, 07/10/2013 - 06:15 Permalink
Re: functional connectivity maps
Where is the seed-ROI? Would you please present your resultant map?
Submitted by Helen Sawaya on Wed, 07/10/2013 - 15:05 Permalink
Re: functional connectivity maps
Thank you for your reply.
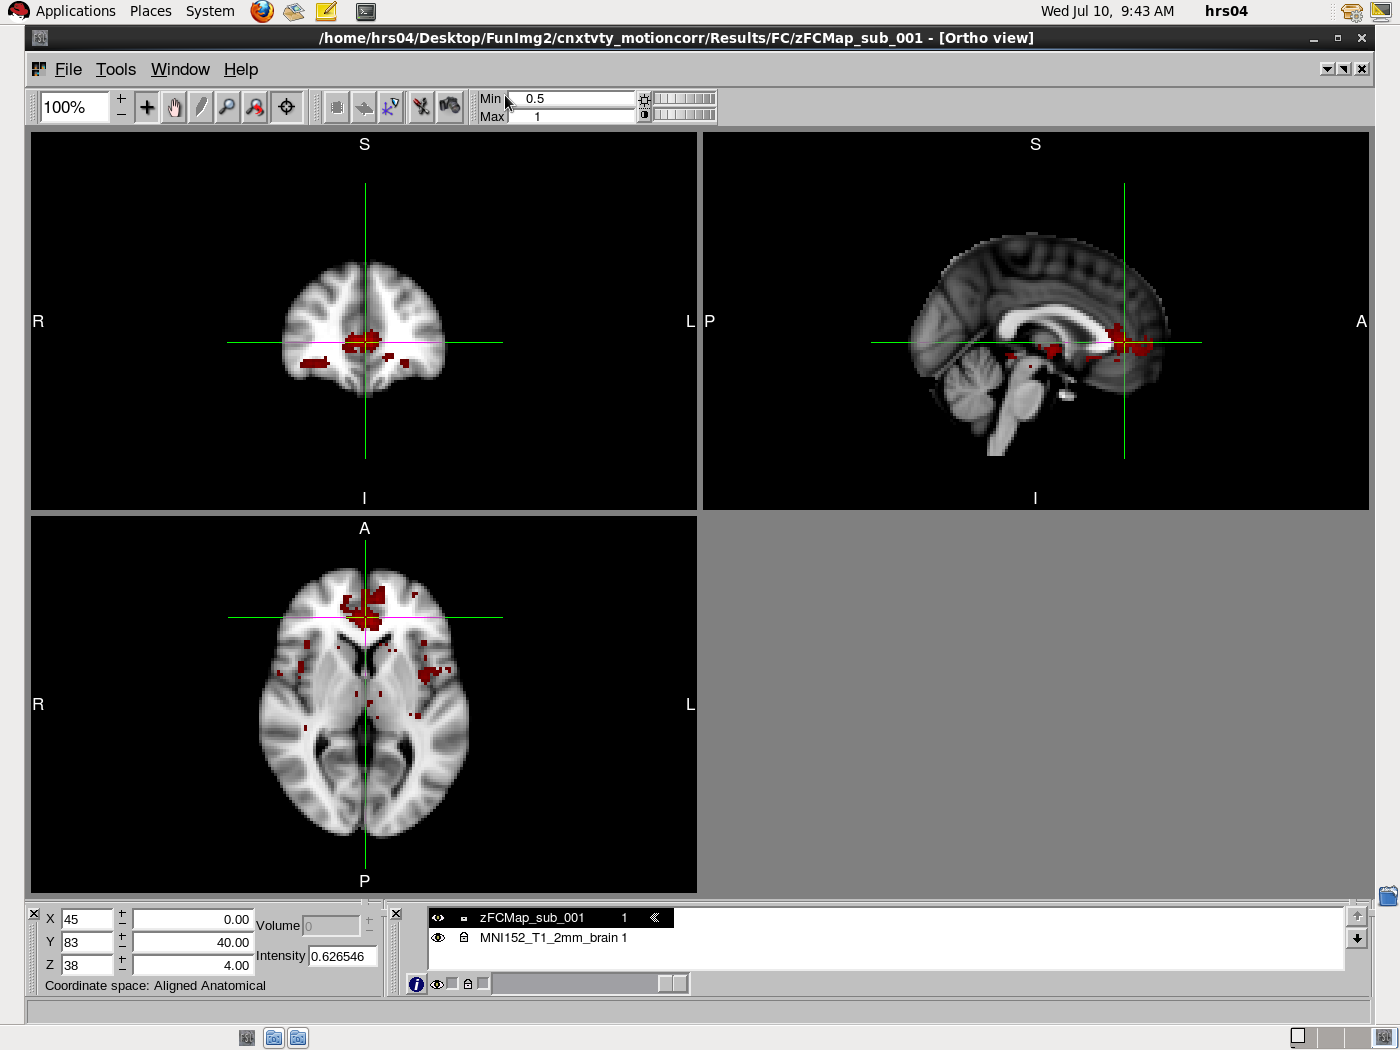
My seed is a region in the ventromedial PFC. I will attach the zFC maps for one of the subjects. The threshold I used to view this image is z=0.5 because anything above that would remove all activation.
Thank you
Helen
(I have uploaded the file to the server, please do let me know if you have received it. Thanks)
Submitted by ZHANG_RESTadmin on Thu, 07/11/2013 - 21:50 Permalink
Re: functional connectivity maps
i m sorry that i cannot find your attachment.
and i do agree with Dr. Zang's comment that the z transformed FC map is largely depended on the seed region location.
i checked my zFC map when i put seed region in PCC, one of the key regions in default mode network, and found for individual map, the z value is not as big as you thought. Even in PCC areas which is near by the seed region, the z value is less than 1.9.
Submitted by Helen Sawaya on Fri, 07/12/2013 - 18:33 Permalink
Re: functional connectivity maps
Thank you for your reply!
Submitted by Helen Sawaya on Fri, 07/12/2013 - 21:26 Permalink
Re: functional connectivity maps
I have attached the zmap to this post. It represents functional connectivity between a cluster in the ventromedial PFC and all other voxels. The z values do appear small, even less than 1. Is the output thresholded?
Thank you
Helen