Submitted by ant80 on Thu, 07/10/2014 - 04:22
Hi all,
I am new to DPARSF. Recently ran 10 subjects' rsfMRI through DPARSF and got the results. However I am not able to understand the results generated by the software. I have attached the screenshot of the settings on DPARSF that I ran, so that, I hope, should be helpful. 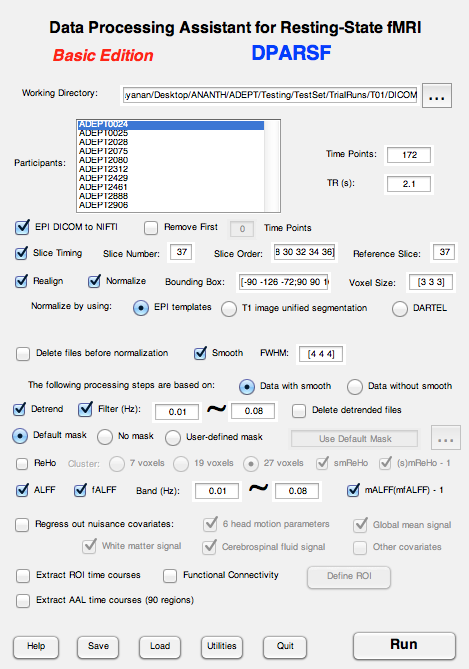
File Structure: Inside each folder contains the following: study ID>Resting>DICOM images (1 per volume). And each one of the ADEPT study folders are in a parent folder called FunRaw.
With this setting, I understand that DPARSF creates the following sibbling file/folders to the FunRaw folder:
DPARSF_AutoSave_2014_7_8_14_18.mat (file)
FunImg
FunImgNormalized
FunImgNormalizedSmoothed
FunImgNormalizedSmoothedDetrended
FunImgNormalizedSmoothedDetrendedFiltered
PicturesForChkNormalization
RealignParameter
Results
Results folder contains 2 subfolders, ALFF and fALFF, each of which contain .nii files of ALFFmap,mALFF-1_map, mALFFmap and zALFFmap for each of the subjects within the folders. What do each of these represent?
I am confused about the significance of this. How can I use these maps in SPM to get group results? And what do each of these mean? Thanks in advance!
'Sincerely,
- Ananth
Submitted by ZHANG_RESTadmin on Thu, 07/10/2014 - 10:53 Permalink
Re: Need Explanation of Results
I think your question is mainly about the Result folder.
In this folder, your all kinds of resting-state fMRI-derived results will be stored. Since you had checked ALFF and fALFF, you would get two subfolders in it.
In each folder, there are each subject's ALFF map (original ALFF value), mean corrected ALFF map (mALFFmap: original ALFF value/global ALFF value, the global ALFF means the averaged ALFF across all voxels in the brain), if you wanna perform within-group analysis, e.g., one-sample t test, you can use mean corrected ALFF map minus 1 (because mALFFmap is mean corrected, so the goal is to find out which brain areas have different ALFF value than the global mean ALFF, or have mALFFmap value different from 1, or have mALFFmap-1 different from 0). That;s why you also got mALFFmap-1_map.
fALFF is another metrics which is similar to ALFF. fALFF means fractional ALFF value, it is the propotion of ALFF value against the whole frequency power. It's also a normalized ALFF value which was proposed to supress the physiological noise.
Submitted by ant80 on Fri, 07/18/2014 - 00:06 Permalink
Re: Need Explanation of Results
Thank you for your response. I've read your response a million times, and I have a few clarifications. Let me see if I understand what you said.
Each voxel in the ALFFmap contains one particular value. But it should always contain a positive value, right? Because that is that square root of the power spectrum (frequency transform) between 0.01 and 0.08 Hz. Or is it the average of that power spectrum between those frequencies? I am guessing it is the 2nd one because that would be the a single number that is contained as the intensity value of the particular voxel. Am I correct?
Mean corrected ALFF should also be positive. Range of values would vary from 0 to a value greater than 1, so it would be unimodal and right skewed, with the mode at around 1. Am I correct?
If I am correct, mALFF-1_map is simply mALFFMap with each of the voxel intensities subtracted by 1. So there will be negative values for some of these voxels. Am I correct?
Also, what is the zALFFMap? I am not sure I understand that.
Finally, how do I go from these results to get group maps like the ones I can publish in papers? Should I run a second level group analysis on SPM with Specify 2nd-level with a 1-sample t-test and select the mALFF-1_map scans that DPARSF generates?
Thanks in advance!
'Sincerely,
- ant
Submitted by ZHANG_RESTadmin on Sat, 07/19/2014 - 17:35 Permalink
Re: Need Explanation of Results
Each voxel in the ALFFmap contains one particular value. But it should always contain a positive value, right? Because that is that square root of the power spectrum (frequency transform) between 0.01 and 0.08 Hz. Or is it the average of that power spectrum between those frequencies? I am guessing it is the 2nd one because that would be the a single number that is contained as the intensity value of the particular voxel. Am I correct?
yes you are right, the 2nd one is correct, you may need to see fig 1 if you wanna understand ALFF more in Zang et al., 2006, Altered baseline brain activity in children with ADHD revealed by resting-state functional MRI.
Mean corrected ALFF should also be positive. Range of values would vary from 0 to a value greater than 1, so it would be unimodal and right skewed, with the mode at around 1. Am I correct?
yes, mALFF is also larger than zero (unimodal? I don't understand), right skewed? I am not sure (I guess so becasue it can not be smaller than 0 but can be larger than 1 or even larger. the mean should be around one.
If I am correct, mALFF-1_map is simply mALFFMap with each of the voxel intensities subtracted by 1. So there will be negative values for some of these voxels. Am I correct?
YES
Also, what is the zALFFMap? I am not sure I understand that.
zALFF comes from another calculation method. The ALFF value in each voxel will be substracted by global mean (global mean is the mean ALFF within the brain mask) and then divided by STD of all the ALFFs in the brain mask. So it will be negative or positive, with the mean of zero (mean = 0, std = 1, like a z distribution).
Finally, how do I go from these results to get group maps like the ones I can publish in papers? Should I run a second level group analysis on SPM with Specify 2nd-level with a 1-sample t-test and select the mALFF-1_map scans that DPARSF generates?
If you want to perform two-sample t-tests, or between-subject one-way ANOVA, you can use either mALFF, or mALFF-1, or zALFF ( I recommend mALFF). If you want to perform one-sample t test, I suggest you use mALFF-1 (H0: mean of mALFF-1 = 0), if you insist to use mALFF, you should compare mean of mALFF with 1 (H0: mean of mALFF = 1). All these analyses you can do them using REST --> statistical analysis. There have been lots of publications.
If you want to use SPM, 2nd level analysis is required if you need to do some group inferences.
Submitted by ant80 on Tue, 07/22/2014 - 00:09 Permalink
Re: Need Explanation of Results
Hi Zhang, this is extremely helpful. Thank you so much for taking the time to explain it to me!