Resting-State fMRI Data Analysis Toolkit V1.4 (静息态功能磁共振数据处理工具包 V1.4)
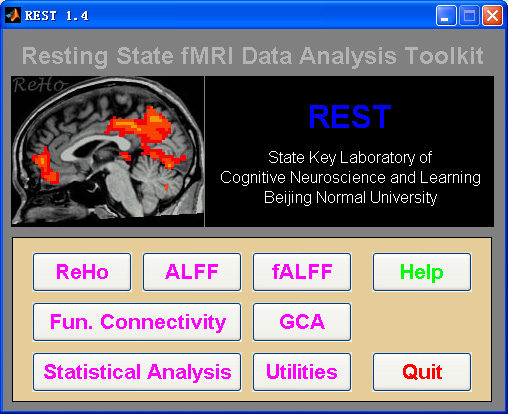 |
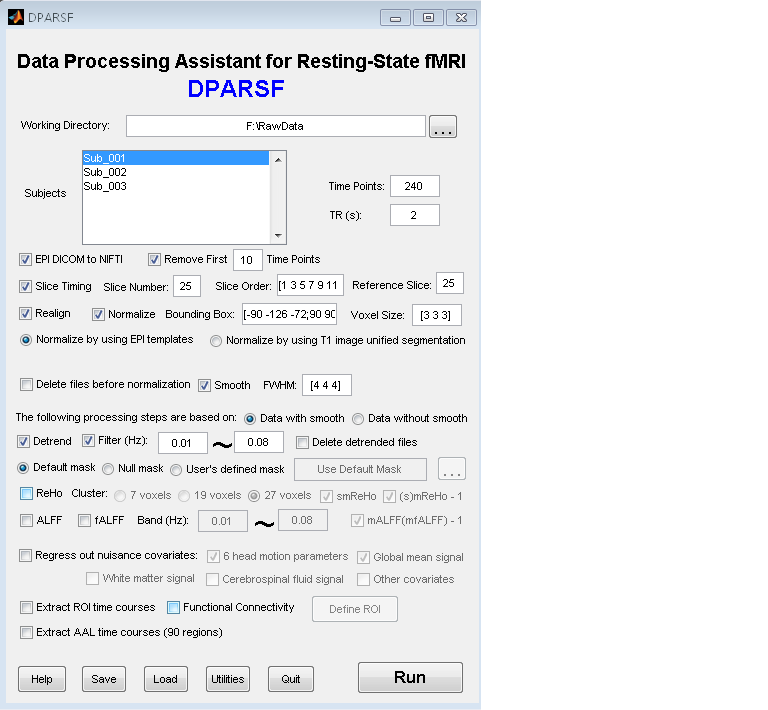
Resting-State fMRI Data Analysis Toolkit (REST) is a convenient toolkit to calculate Functional Connectivity (FC), Regional Homogeneity (ReHo), Amplitude of Low-Frequency Fluctuation (ALFF), Fractional ALFF (fALFF), Gragner causality and perform statistical analysis. You also can use REST to view your data, perform Monte Carlo simulation similar to AlphaSim in AFNI, calculate your images, regress out covariates, extract ROI time courses, reslice images, and sort DICOM files. Download a MULTIMEDIA COURSE would be helpful for knowing more about how to use this software. Add REST's directory to MATLAB's path and enter "REST" in the command window of MATLAB to enjoy it.
The latest release is REST_V1.4_100426. |
New features of REST V1.4 release 100426:
1. Fixed a reading and writing bug of compatibility with SPM8.
New features of REST V1.4 release 100420:
1. In previous release of REST, there is a simple procedure for removing linear trend in bandpass filter (as fourier_filter.c in AFNI) regardless if detrend calculation has been performed before bandpass filter or not. Now this simple procedure for removing linear trend in bandpass filter has been canceled.
2. In previous release of REST, bandpass filter (or ALFF and fALFF) determined the frequency band a little smaller than the real wanted frequency band. For example, if the wanted band is 0.01-0.08, TR=2S, Time points=240, then the real wanted frequency band is 0.0104-0.07917, but the previous release of REST will determined to 0.0083-0.07708. This bug has been fixed in REST V1.4 release 100420. These two modifications will make the results obtained by REST V1.4 slightly different from those obtained by previous version of REST, please be careful.
3. REST Statistical Analysis: Statistical analysis module has been added -- One-Sample T-Test, Two-Sample T-Test, Paired T-Test, ANCOVA, and Correlation Analysis. The operations are much easier than the operations in SPM. Especially, the covariate images can be added into statistical analysis (such as adding GM volume images as covariates in statistical analysis). (by YAN Chao-Gan)
4. REST Slice Viewer: Fixed a bug in displaying overlay with different bounding box from those of underlay. For example, if you use ch2.nii as underlay, but the bounding box of overlay is not [-90 -126 -72;90 90 108] (e.g. if you use SPM’s default: [-78 -112 -50; 78 76 85]), then REST Slice Viewer will display in a wrong way. Please re-display your image with REST V1.4 if your data with a bounding box different from [-90 -126 -72;90 90 108]. (by DONG Zhang-Ye)
5. REST-GCA: The Beta 1.0 release 100201 of REST-GCA supports only the signed-path coefficient maps at a fixed order=1 condition. In order to implement a more general GCA program, we updated REST-GCA. The updated version integrates two algorithms: the coefficient-based GCA and the residual-based GCA. The updated version supports any order. Please refer to http://www.restfmri.net/forum/REST-GCA for more details. (by ZANG Zhen-Xiang)
- Read more about Resting-State fMRI Data Analysis Toolkit V1.4 (静息态功能磁共振数据处理工具包 V1.4)
- 5 comments
- Log in or register to post comments
- 76298 reads